Saturday, July 18, 2026

[NJFAC] Greenhouse:our K-shaped economy now even more unequal


Trump has made our K-shaped economy even more unequal  4 Jun 2026 Steven Greenhouse 

While wealthy Americans hail a booming stock market, the rest of us worry about rising inflation and people struggling to make ends meet

In case you’re not familiar with the concept of the K-shaped economy, it’s an important idea that captures a lot about Trump’s America. Wealthy Americans are represented by the line of the K that angles sharply upward to the right, while the line of the K that dips downward represents non-rich Americans and the difficulties they face.

The economy’s K-shape has been growing worse in recent months, in large part because of Donald Trump’s policies. The wealthy people’s line is climbing further upward, while the line for the non-wealthy – the vast majority of Americans – has fallen further.

Viewed another way, the K-shaped economy is all about income and wealth inequality, and those are growing palpably worse under Trump.

For the country’s wealthy, things are going gangbusters as the S&P 500 and other stock indices keep hitting record highs, notwithstanding Trump’s costly, unsuccessful war against Iran. The richest 10% of Americans own 93% of all stock held by US households, and that means millions of average Americans aren’t feeling Wall Street’s rise – although they’re very much feeling inflation’s rise as it has climbed to nearly 4%, as hourly earnings fail to keep up with rising prices and as gas prices have jumped about 50% since Trump began bombing Iran. What’s more, workers’ hourly pay has risen by a mere 3% since 2019 (after adjusting for inflation), while corporate profits have jumped by 50%.

It’s a tale of two Americas. When some people look at the economy, they see a booming stock market, low unemployment, consumer spending chugging along and friends jetting off to overseas vacations. But those on the bottom end of the K see something very different: rising inflation, a sluggish job market, sky-high gas prices, problems with affordability and friends struggling to make ends meet. One big reason that consumer spending hasn’t tanked is that the richest, we’re-doing-just-fine 10% of Americans account for nearly half of all consumer spending.

The economy’s K shape is visible in many places. Airlines are adding more business class seats as the wealthy clamor for those higher-priced spots. But Spirit, the low-price airline that many non-rich Americans relied on, has gone belly up. Sales of private jets and fancy yachts have soared even as the Federal Reserve says that more Americans are going hungry than during the pandemic. The McDonald’s CEO complained recently of a “two-tier economy”, with sales to lower-income Americans declining even as McD’s added premium, higher-end products, like the Big Arch burger, which costs between $7.50 and $13, depending on the location. While wealthy Americans fly to Greece and safaris in Africa, many average Americans are so squeezed by $4.26-a-gallon gas that they’re cutting back on travel and piling on record amounts of debt. US consumers have shelled out $52bn extra for gas due to the price increases, and as with Trump’s tariffs, soaring gas prices have squeezed non-rich Americans far more than wealthy ones. Americans in the bottom quarter by income (earning under $40,000 a year) spend approximately 4% of their income on average for gas, while households in the top fourth (earning $100,000 or more) spend less than 1%.

With the Iran war pushing up inflation and gas prices, most presidents would seek to show empathy by proclaiming: “I feel your pain.” But Trump did precisely the opposite, telling reporters that he doesn’t care about the economic pain Americans are feeling. “I don’t think about Americans’ financial situation,” Trump said, adding that he only cares about Iran not having a nuclear weapon. Just as Trump has belittled concerns about affordability by saying those concerns are a hoax and con job, he callously belittled Americans’ concerns about soaring gas prices. “This is peanuts,” he said about high gas prices.
....

--
June Zaccone
National Jobs for All Network
http://www.njfac.org

--
This list is only for announcements, so you may not post. To contact the list manager, write to junez [at] njfac.org
---
You received this message because you are subscribed to the Google Groups "goodjobs" group.
To unsubscribe from this group and stop receiving emails from it, send an email to goodjobsforall+unsubscribe@googlegroups.com.
To view this discussion visit https://groups.google.com/d/msgid/goodjobsforall/CAPV%3DhmAdnBn2R%2BWqMD_u-RE0k5VY1NVC2UCJYEt7CMfKyzuEzg%40mail.gmail.com.

Wednesday, July 8, 2026

[NJFAC] Decline of employee compensation constrains consumption

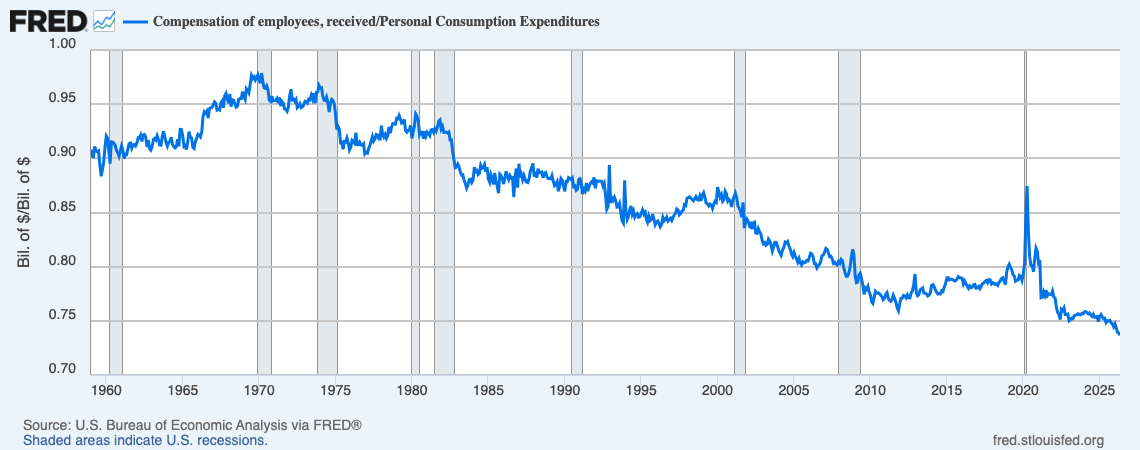
Why are Americans so unhappy? Here's a very straightforward graph to help explain why Americans are so glum, and angry.

A graph of 'compensation of employees, received' as a fraction of personal consumption expenditure

(or on FRED.)

A simple interpretation of the graph is that until 1982, the "average" American household could afford more than 90% of average consumption out of labor income alone. You didn't need hereditary asset wealth, some accumulated chunk of savings, to lead an average life. You could just get a fucking job — an average fucking job, not some amazing "career" position you sucked dicks your whole life to qualify for — and your family could live something close to a full, normal American life with your head held high.

By 2010, the "average" American household could afford less than 80% of average consumption from labor income alone. That's not a full, normal, American life, but a substandard life, a lifestyle of losers. In the current era, a household needs either property wealth and income or someone with an extraordinary job to support full, normal lives. A household of people with average jobs and no other income now affords less than 75% of average consumption.

You can nitpick this interpretation. A substantial fraction of US households include no employed people. So, conditional on anybody working, labor income may provide close to 90% of the average! Whatever. The information is not in the absolute numbers, but in the rather shocking decline in labor income relative to the consumption that defines a normal life.

Discussions like this always devolve to questions of the average versus the median. Both compensation and consumption are "right skewed" — the average will be higher than the median. Maybe what the median, often taken to mean "typical", worker earns would not have declined so much relative to median, "typical", consumption?

But what "average consumption" is a proxy for here is the consumption that defines living "a full, normal American life with your head held high". The definition of a "full, normal" life is not a typical life, unless one presumes that "full, normal lives" are in fact typical. This essay is an attempt to explain the apparent opposite, that it is increasingly common for people to lead economic lives they do not consider full. An unhappy life might be normal in the sense of "common", but not at all normal in the sense of meeting society's norms about how a life is successfully led.

Norms about what constitutes a "normal" life in America are set by the upper middle class. Americans don't feel like losers because they can't live like Elon Musk lives. But they feel like losers if they don't have ready access to high-quality health care, if their schools aren't safe and solid enough to offer education and opportunities to kids who do the work, if those kids can't go to college without burying themselves in debt, if their neighborhoods aren't safe and well maintained and well served commercially. All of these are upper-middle-class goods in the United States. Just because the quality of normative goods has improved in absolute terms since, say, 1970 doesn't mean that it is discretionary whether one pursues them, or that households gain in self-perceived welfare by paying up for them. A family that contented itself with childrearing goods that were common in the 1980s — say, a key on a shoestring around the neck of a "latchkey kid" — today risks losing custody of their kids to child protective services. A person who in 1970 would have enjoyed living cheaply in a downtown SRO no longer has the option of that form of housing.

Broadly speaking, at any given time the consumption bundles that constitute a full, normal life are defined by what is typical among members of the upper middle class. There's no hard threshold. You can be poorer than whatever counts as upper middle class and live a normal life, as long as the life you can buy is not so far from the norms that class sets. But the greater the degree of consumption inequality, the greater the share of society that will be perceived, and most importantly perceive itself, as living something less than a full, normal life.1

So using an average rather than a median for our numerator does not overestimate what we are interested in. But our denominator, average compensation, is an overestimate. We would prefer a ratio of average consumption (or even 80th to 90th percentile consumption) to median labor compensation. Our measure overestimates, rather than underestimates, the ability of a typical person to lead a full and normal life out of labor compensation alone.

A lot of discussions of "inequality" look at inequality within wage measures. That largely misses the point. The main dividing line in American life is between workers with few assets and the class of people who substantially supplement their consumption and economic security via asset wealth.

Between September 1969 and May 2026, the share of PCE that can be accounted for by labor compensation falls almost 24 percentage points. The share of "entrepreneurial" proprietors' income decreased over the period as well, adding an additional 3 percentage points of decline to explain. An increase in measured asset income (dividends and interest, basically) accounts for about 3 percentage points. An increase in rental income accounts for about 2 percentage points of the change. An increase in net transfer income accounts for about 11 percentage points of the change. And factors outside of the components measured as Personal Income account for an additional 11 percentage points of the change. Those outside factors include capital gains, realized and unrealized, as well as changes in the role of saving and borrowing for funding expenditures. Broadly, income from capital gains, spending out of savings, and/or borrowing (largely against assets as collateral) account for these remaining 11 percentage points.2

All in all, the role of work income, labor and entrepreneurial, declined by 27 percentage points. The role of asset-related income and borrowing accounts for about 16 of those percentage points, while the role of transfers accounts for about 11 of them.

It's worth discussing the role of net transfer payments. Under a very universalist transfer state, one might argue that the 11 percentage point increase in the role of transfers shouldn't make anybody glum. But the United States' transfer system is far from universal. Its beneficiaries are mostly the poor (whose modest means-tested benefits are unlikely to persuade them things are great), the old, veterans, the unemployed, and the self-identified disabled. Most working Americans are net contributors, rather than recipients of benefits. That doesn't make these benefits bad! Of course we want a social insurance system that receives a broad base of contributions and pays out to those who can't work or can't earn a great living when they do.

But from the perspective of working Americans without asset wealth, who are net contributors rather than net beneficiaries of these transfers, these payments contribute to income streams that are not theirs. Of course we should make the political case that insurance programs against sickness and unemployment, disability and poverty, and the debilitations of old age benefit everyone. But given the vast gap that has grown between labor income and full economic participation, it's understandably a hard sell to ask workers to be net contributors. One thing that would help is providing more universal benefits, so that payers perceive themselves more as purchasing benefits rather than funding charity. Another thing that would help would be reducing the barrier placed between labor income and full participation created by the increasing role of asset wealth.

In a decent society, it shouldn't be that bad to become penniless. One should always be able to pick oneself off the floor and afford a decent life from the wages of a job. Societies that allow their definition of a decent life to expand very far past what employment and universal benefits can typically buy are asking for turmoil and trouble.


  1. Also, estimates of unhappiness based on consumption inequality alone will understate the problem. People will go to extraordinary lengths and take extraordinary risks to sustain what they take to be a normal life. A not inconsiderable share of those who seem to afford a normal life are in fact quietly suffering from financial precarity, the miseries that come when you know you are living on borrowed time and money.

  2. Declining tax rates may also have played a role, but over the period, non-payroll taxes decrease especially on asset wealth and unusually high incomes. (Payroll taxes increase, but are accounted for within net transfer income.)

link from Ian Welsh: 

Most US Jobs Won’t Support An American Lifestyle

--
June Zaccone
National Jobs for All Network
http://www.njfac.org

--
This list is only for announcements, so you may not post. To contact the list manager, write to junez [at] njfac.org
---
You received this message because you are subscribed to the Google Groups "goodjobs" group.
To unsubscribe from this group and stop receiving emails from it, send an email to goodjobsforall+unsubscribe@googlegroups.com.
To view this discussion visit https://groups.google.com/d/msgid/goodjobsforall/CAPV%3DhmB2eoENrao%3DjQCpTJgW_jCBKr%3DhOvtsLSoiWaLrjapHmQ%40mail.gmail.com.

Monday, July 6, 2026

[NJFAC] Baker: Social Security Shortfall and Trump’s Big Military Budget


The Social Security Shortfall and Trump’s Big Military Budget The elites tell us there is infinite money for the military, but not enough for Social Security 

The release of the 2026 Social Security Trustees Report got the usual suspects (a.k.a. “very serious people”) genuflecting about the large projected shortfall. As of 2034, the program is projected to be unable to pay full benefits. This would mean a 22% cut in benefits if no additional revenue is added.

There are three points worth making here.

1) As an economic matter, the projected depletion of the trust fund and resulting shortfall in the program means nothing;

2) The main reason for the projected shortfall is the upward redistribution of income over the last half-century;

3) The projected shortfall is far less money than the increase in military spending that Donald Trump is requesting for his 2027 budget.

Trust Fund Accounting

On the first point, the spending to repay the bonds held from the trust fund in 2033 comes from the Treasury. Its impact on the economy would be the same as the spending in 2034, when the trust fund no longer holds any bonds.

There is an issue that the law gives the program a claim to the funds needed to repay the bonds it holds. Social Security does not have a claim to the money needed to pay full benefits once the last bonds are sold and the trust fund is depleted.

This is an important legal point, but from an economic standpoint, it is money from the Treasury in both cases. If the country could afford to pay full benefits in 2033 when the trust fund held bonds. It can afford to pay full benefits after it has sold all its bonds, however the law would need to be changed.

Upward Redistribution Hurt Social Security’s Finances

In 1982, the last time the program had a major overhaul, just 10% of wage income went to high wage earners whose income escaped taxation by being over the cap (currently around $185,000) for wages subject to the 12.4% Social Security tax. In the last quarter century, close to 17% of wage income went over the cap.

This upward redistribution of wage income, coupled with the redistribution from wages to profits in the last quarter century, has substantially reduced the amount of revenue going into the trust fund. It shouldn’t be surprising that the people who engineered the upward redistribution of the last half-century, through trade policy, stronger patent and copyright protections, bank bailouts, and tech policy, now want to reduce people’s Social Security benefits.

Donald Trump’s Increase in Military Spending is Twice the Size of the Shortfall Projected for 2034

The media seem to take pride in reporting huge budget numbers without providing any context that would make them meaningful to their audience. The projected Social Security shortfall is a great example. The usual group of budget hawks is being brought out to tell us that it is a huge program, which we can’t afford, and requires cuts.

Yet, we did not hear the same chorus in response to Donald Trump’s proposed increase in the military budget from $864 billion in the last year of the Biden presidency to $1,500 billion in 2027. Even adjusting for inflation between the two years, the increase would still be close to $590 billion. There was no rationale given for why the country suddenly needs to spend so much more on its military. Trump certainly did not propose this sort of massive increase in spending in his campaign.

The proposed increase in military spending dwarfs the shortfall projected in the Social Security program for 2034.....

--
June Zaccone
National Jobs for All Network
http://www.njfac.org

--
This list is only for announcements, so you may not post. To contact the list manager, write to junez [at] njfac.org
---
You received this message because you are subscribed to the Google Groups "goodjobs" group.
To unsubscribe from this group and stop receiving emails from it, send an email to goodjobsforall+unsubscribe@googlegroups.com.
To view this discussion visit https://groups.google.com/d/msgid/goodjobsforall/CAPV%3DhmCm6zQ7SrwuTRaHBgj8Fem0PddAg2npGtPiFdgNL2ZjmA%40mail.gmail.com.

Wednesday, July 1, 2026

[NJFAC] China may have fewer poor people than the US

China may have fewer people living in poverty than the US  One system covers basic needs for its poor while the other doesn't Jostein Hauge Jun 12, 2026

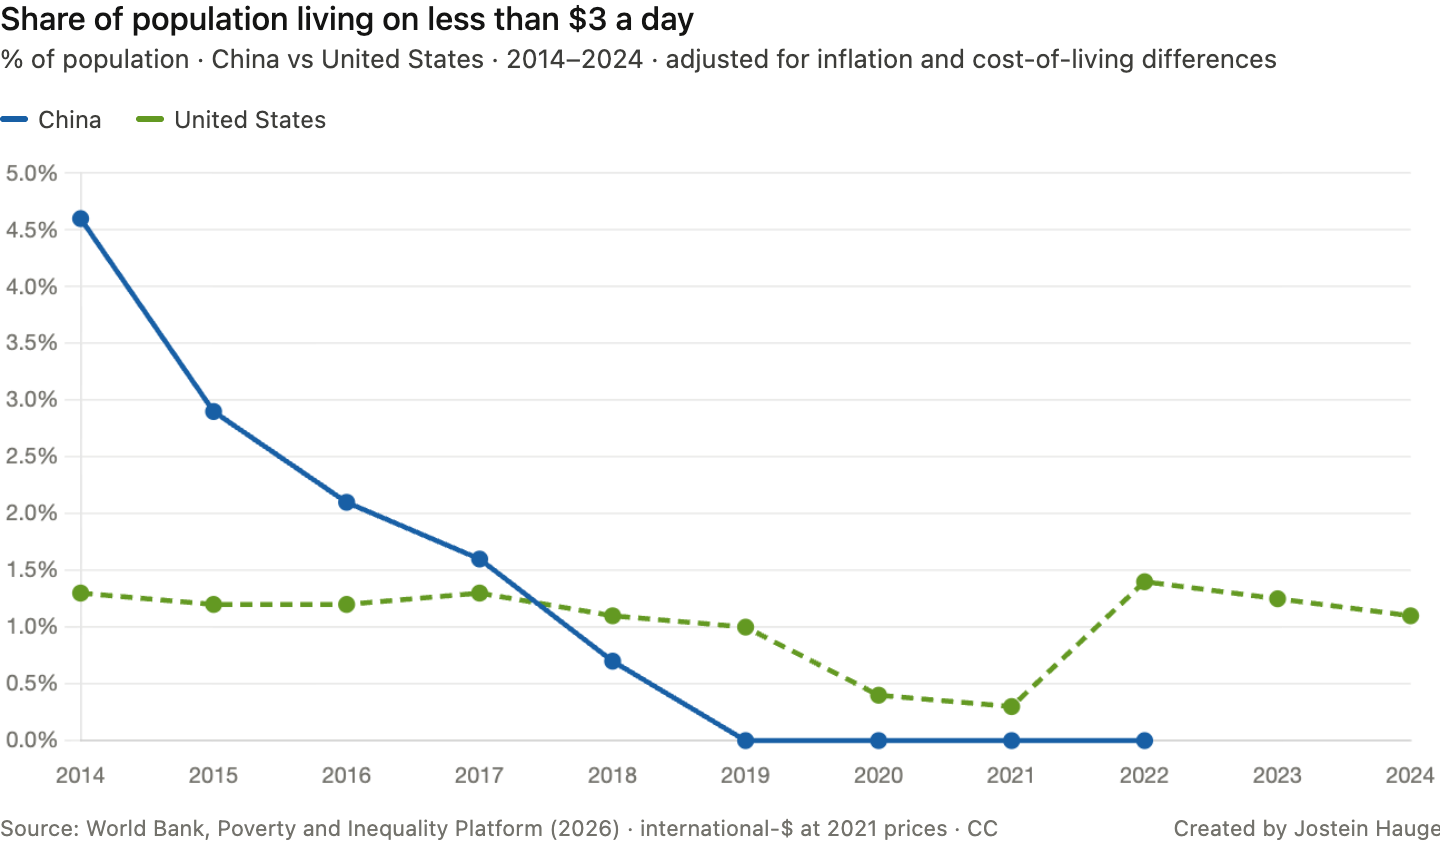
Some readers might find it odd to even entertain the possibility that China has fewer people living in poverty than the US. China’s GDP per capita is about one-sixth of the US’ — one-third once you adjust for purchasing power. Given a gap that large, surely China must have far more people living in poverty, right?

Data from the World Bank challenges this intuition. According to the Bank, extreme poverty in China was eradicated by 2019, while the rate in the US still sits at around 1%. Extreme poverty here is defined as living on less than $3 per day, adjusted for differences in cost of living. So on the World Bank’s own benchmark, more Americans live in extreme poverty than Chinese, not only as a share of the population but also in absolute numbers, seeing that China has officially eradicated poverty.

....
--
June Zaccone
National Jobs for All Network
http://www.njfac.org

--
This list is only for announcements, so you may not post. To contact the list manager, write to junez [at] njfac.org
---
You received this message because you are subscribed to the Google Groups "goodjobs" group.
To unsubscribe from this group and stop receiving emails from it, send an email to goodjobsforall+unsubscribe@googlegroups.com.
To view this discussion visit https://groups.google.com/d/msgid/goodjobsforall/CAPV%3DhmDsNL-ThcdJ%3DWMZr0tdCVFR1QOhqkceStfK6S0sEutM1g%40mail.gmail.com.